Team2 · October 17, 2025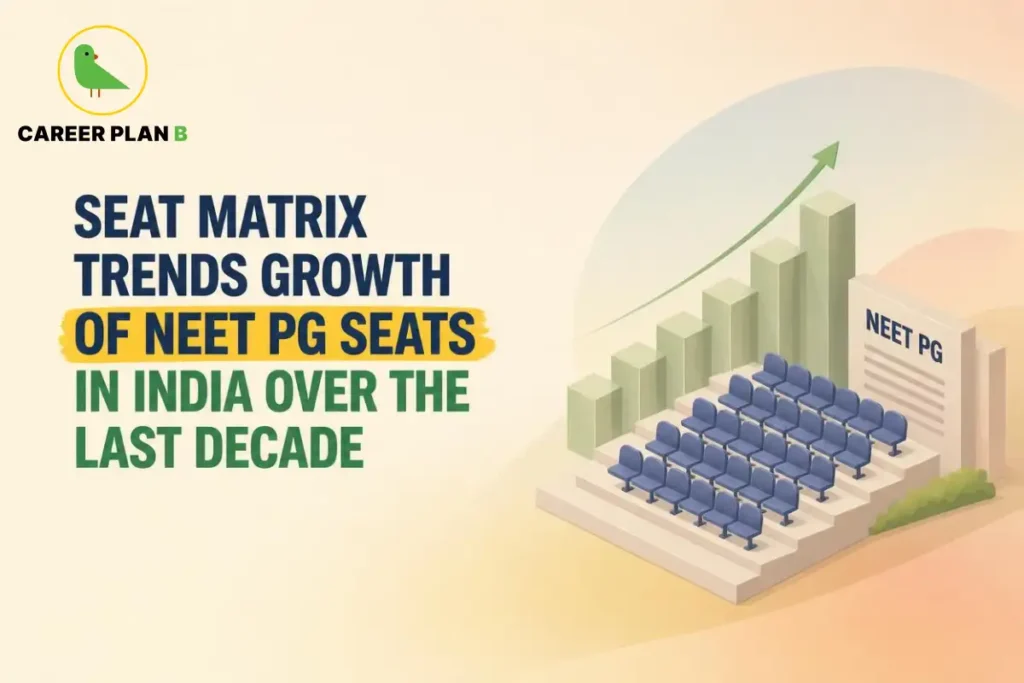
Introduction
If you’re prepping for NEET PG today, here’s some genuinely good context: NEET PG seats in India have grown dramatically over the last decade, even though the competition still feels intense every single year. Understanding this growth helps you plan your strategy with real numbers, not just anxiety.
This guide tracks NEET PG seats in India year by year, breaks down the state-wise distribution, and explains what’s actually driving the expansion, government policy, new colleges, or something else.
NEET PG Seat Increase: The Decade at a Glance
The NEET PG seat increase over the last ten years is substantial. According to parliamentary and government data widely reported across education sources, India had approximately 31,185 PG medical seats in 2013-14. By the 2024-25 session, that figure had grown to somewhere between 70,000 and 73,000+ seats, commonly cited as a 127% increase. The number of NEET PG-affiliated colleges grew alongside this, from 387 in 2014 to over 700 by 2024-25.
This kind of increase in NEET PG seats reflects a sustained, multi-year government push rather than a single policy change.
NEET PG Seats Year Wise: Recent Annual Additions
Looking at NEET PG seats year wise for the most recent stretch shows the growth hasn’t slowed down:
| Academic Year | Seats Added |
|---|---|
| 2020–21 | 4,983 |
| 2021–22 | 4,705 |
| 2022–23 | 2,874 |
| 2023–24 | 4,713 |
| 2024–25 | 4,186 |
| 2025–26 | 7,619 |
NEET PG seat trends show a consistent upward pattern, with 2025-26 seeing the largest single-year jump in this recent stretch. Treat exact yearly figures as approximate, since sources and NMC’s own periodic revisions can shift the count slightly.
Total NEET PG Seats: Where Things Stand Now
Total NEET PG seats across MD, MS, Diploma, and DNB combined are commonly reported in the 70,000-74,000 range as of the most recent sessions, though the number of NEET PG seats figures vary somewhat by source and exactly which categories are counted together. A useful split: MD/MS/Diploma seats (counted under the standard NEET PG matrix) run in the mid-50,000s to around 58,000, while DNB and other seats add substantially more on top.
Government PG seats in India make up roughly half this total, with the remainder in private institutions. NEET PG government seats in India and government medical PG seats in India are generally preferred by candidates for their lower fees and often stronger clinical training reputation.
Have Any Doubts?
State-Wise NEET PG Seats: Government vs Private Breakdown
State-wise NEET PG seats vary enormously by state. Here’s the full government vs private breakdown across India:
| State / UT | No. of Colleges | Government PG Seats | Private PG Seats |
|---|---|---|---|
| Andhra Pradesh | 37 | 1,923 | 1,645 |
| Arunachal Pradesh | 1 | 0 | 0 |
| Andaman & Nicobar Islands | 1 | 0 | 0 |
| Assam | 13 | 738 | 0 |
| Bihar | 21 | 908 | 321 |
| Chandigarh | 1 | 585 | 0 |
| Chhattisgarh | 14 | 475 | 114 |
| Dadra & Nagar Haveli | 1 | 0 | 0 |
| Delhi | 10 | 2,889 | 49 |
| Goa | 1 | 137 | 0 |
| Gujarat | 40 | 2,186 | 724 |
| Haryana | 15 | 432 | 465 |
| Himachal Pradesh | 8 | 264 | 92 |
| Jammu & Kashmir | 12 | 606 | 51 |
| Jharkhand | 9 | 263 | 0 |
| Karnataka | 70 | 1,856 | 4,593 |
| Kerala | 33 | 1,077 | 868 |
| Madhya Pradesh | 27 | 1,489 | 859 |
| Maharashtra | 68 | 3,576 | 2,498 |
| Manipur | 4 | 255 | 0 |
| Meghalaya | 1 | 37 | 0 |
| Mizoram | 1 | 0 | 0 |
| Nagaland | 1 | 0 | 0 |
| Odisha | 17 | 725 | 509 |
| Puducherry | 9 | 314 | 720 |
| Punjab | 12 | 408 | 384 |
| Rajasthan | 35 | 2,255 | 1,033 |
| Sikkim | 1 | 0 | 34 |
| Tamil Nadu | 74 | 2,765 | 2,369 |
| Telangana | 56 | 1,504 | 1,608 |
| Tripura | 2 | 85 | 6 |
| Uttar Pradesh | 68 | 2,301 | 1,919 |
| Uttarakhand | 8 | 1,572 | 260 |
| West Bengal | 35 | 1,791 | 297 |
NEET PG seats by state clearly clusters around a handful of leaders. Karnataka, Tamil Nadu, Maharashtra, Uttar Pradesh, and Telangana collectively offer the largest number of PG seats across government and private institutions, and are widely considered the major contributing states in terms of PG seats in India, alongside Gujarat.
State-wise PG Medical Seats: MD vs MS Split (Select States)
Breaking down state-wise NEET PG seats further by MD and MS course type for select states:
| State | MD Seats | MS Seats |
|---|---|---|
| Karnataka | 2,849 | 1,412 |
| Tamil Nadu | 1,340 | 740 |
| Uttar Pradesh | 1,278 | 609 |
| Andhra Pradesh | 1,020 | 609 |
| Telangana | 1,020 | 526 |
| Rajasthan | 529 | 266 |
| Puducherry | 447 | 260 |
| Haryana | 327 | 145 |
| Bihar | 210 | 107 |
| West Bengal | 187 | 97 |
| Uttarakhand | 157 | 72 |
| Chhattisgarh | 80 | 34 |
| Himachal Pradesh | 63 | 29 |
| Sikkim | 25 | 7 |
Primary government source
NMC — PG (Broad Specialist) Seat Matrix as on 30 January 2026
NEET PG State Quota: How Seats Split Nationally
Roughly half of all government PG seats nationwide go through NEET PG state quota, reserved for candidates meeting that state’s domicile requirements, while the other half falls under the All India Quota (AIQ), open to candidates from any state. State quota in NEET PG rules, including domicile and residency criteria, vary meaningfully by state, so what applies in Karnataka won’t necessarily apply in Tamil Nadu or Uttar Pradesh.
Read more:- NEET PG Seat Allotment: How It Works
PG Medical Seats Growth: What’s Actually Driving It
A few structural factors explain the sustained PG medical seats growth and NEET PG seat expansion:
- New medical colleges: Both government and private institutions have opened steadily, each adding fresh PG capacity once accredited.
- Increased intake in existing colleges: NMC periodically approves capacity increases at already-running institutions, not just brand-new ones.
- DNB expansion: A growing number of NBEMS-accredited hospitals adding DNB seats has meaningfully padded overall PG capacity nationally.
- Government policy push: Sustained focus on reducing India’s specialist-doctor shortage has kept seat approvals flowing year after year, per NMC’s own stated commitments.
How Career Plan B Helps
Understanding where seats are actually growing, and which states genuinely offer you the best odds, matters as much as your rank itself. Here’s how personalised guidance can help.
- Personalized Career Counselling: Help interpreting state-wise seat trends against your specific rank and category.
- Psychometric & Career Assessment Tests: Assessments to help you weigh branch and location options realistically.
- Career Roadmapping: A plan factoring in AIQ versus state quota strategy based on where you’re eligible.
- Admission & Academic Profile Guidance: Support tracking current seat matrix updates via MCC before counselling.
Get In Touch With Us
Frequently Asked Questions
Q1. What is the growth of NEET PG seats in India over the last decade?
Roughly 127%, from approximately 31,185 seats in 2013-14 to over 70,000 by 2024-25, per widely reported government data.
Q2. What are NEET PG seats in India year wise for recent years?
Recent annual additions: ~4,983 (2020-21), 4,705 (2021-22), 2,874 (2022-23), 4,713 (2023-24), 4,186 (2024-25), and 7,619 (2025-26).
Q3. What is the increase in NEET PG seats over the years?
A steady, near-continuous rise driven by new colleges, expanded intake at existing institutions, and DNB seat growth, rather than one-off spikes.
Q4. What is the total number of NEET PG seats in India?
Commonly reported between 70,000 and 74,000 across MD/MS/Diploma/DNB combined as of the most recent sessions, though exact figures shift as NMC finalises each year’s matrix.
Q5. What are state-wise NEET PG seats in India?
Karnataka, Maharashtra, Tamil Nadu, Uttar Pradesh, and Telangana lead by a wide margin.
Conclusion
NEET PG seats in India have expanded remarkably over the past decade, more than doubling in raw numbers, but that growth hasn’t evenly eased competition, since candidate numbers have grown too, and seat distribution remains heavily concentrated in a handful of states.
Track current seat matrix data directly through MCC before building your counselling strategy. If you’d like help interpreting these trends against your own rank and state eligibility, Career Plan B’s counsellors can walk you through it.